
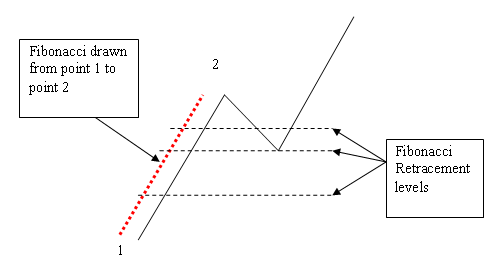
Leonardo Pisano Bigollo is the man who introduced us to fibonacci sequence. First i have to tell you that he introduced to us the numbers as we know them today which are very obvious: 0, 1, 2, 3, 4, 5, 6, 7, 8, 9. We use this in every day life. He did not invent these but he did invent something called fibonacci sequence where each number is basicly the sum of two numbers that preceed it, example: 0, 1, 1, 2, 3, 5, 8, 13, 21, 34, 55, 89,… So what does this numbers have to do with trading. Well based on this numbers we have fibonacci retracement tool which identifies levels where is the end of support or resistance. To get this, you just have to connect high and low of a swing. You can see a quick example here:
WHAT YOU WILL LEARN HERE:
- What is fibonacci tool
- Why is it good and why bad?
- How to use fibonacci tool?
WHY IS IT GOOD AND WHY BAD?
As we said at the end, you must identify the swing first in order to see the fibonacci levels. Problem is that we all see differently where the low and high of a swing can be. Meaning, that someone will fail since it will not show him the correct levels while the trader will think it is correct. That is why it is important to use it correctly otherwise it has no use.
On the other hand, the fibonacci tool is definitely one of most used tools when it comes to technical analysis. Meaning that if enough of traders around the world uses the tool at once, it becomes self fullfilling because all traders would look at same levels and would make similiar decision and similiar trade at once which will then move market into the direction.
HOW TO USE IT?
As we said, first thing you need to do is, identify the swing and its high and low and connect them both with a tool. You have to know that swing high is where you have atleast two candle bars with lower highs on each of the sides. Swing low on the other hand is vice versa meaning that you need to have two bars with high lows on both side. Connect these two with the tool as we said and the levels are going to appear on the chart. After that, you trade accordingly.
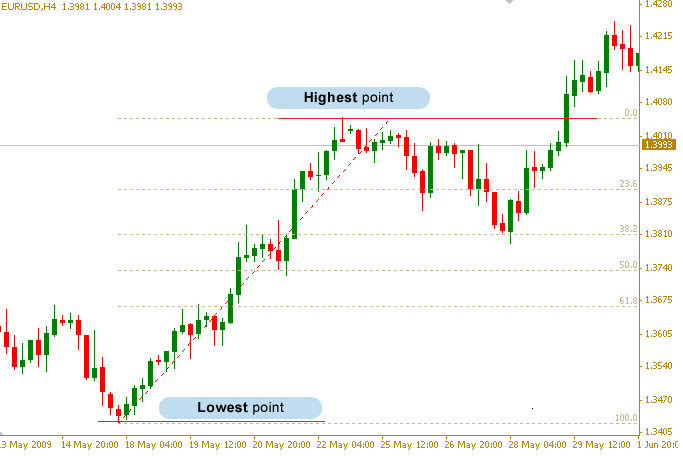
This tool is most useful in a trending market because for example it will find support in an uptrend and it will go higher from there on. This is nicely visible also from the picture example where it tested the support and bounced and then got higher. It is a very good tool to use it on daily basis but i would not advice to rely just on it. Try to rely on more then one and find the ones that suit you best.