Sorry to dissapoint you at the beginning since this is not a fighting tool, it is merely a trading tool but i can get you in the mood since you can get good profits with this tool. In the basics, this tool is a modified version of japanese candles. They may look the same as japanese candlesticks when you look at them but when you actually see how they act you will see they are different and that is because their calculations are different from the japanese candlesticks where you see the opn and closing price and high and low of the time period the candle is representing. Instead, these heikin ashi candles relate to previous candle and they like to remove the noise, means they offer you more smoother price action. With using of this tool you can see easier the trend since it really is simple to use. When you see a closed uptrending heikin ashi candle, means that you can do a call trade. If you see a closed downtrending candle, you can do a put trade.
WHY ARE HEIKIN ASHI CANDLES BAD AND WHY GOOD?
It can happen that they can be late with signalizing you when to go to trade since they calculate and use averages. On the other hand it can be also taken as advantage so you do not get out of the trade too early or in the trade when there is no right moment. If you are already expirinced when it comes to japanes candles trading, you can recognize the patterns formed there which does not happen here with heikin ashi but you are always able to have open 2 charts, one with japanese candles and one with heikin ashi.
You can be most sure here since there is less noise. For as long as you are in the trade within the same color you are ok and in correct direction. Since there is no connection beetwen mathematical calcualtions and candles, you can see much more cleaned out version of price. You can get the heikin ashi candles as a standard with msot of the charting packages so you remove the hassle of searching for it online.
HOW TO USE HEIKIN ASHI?
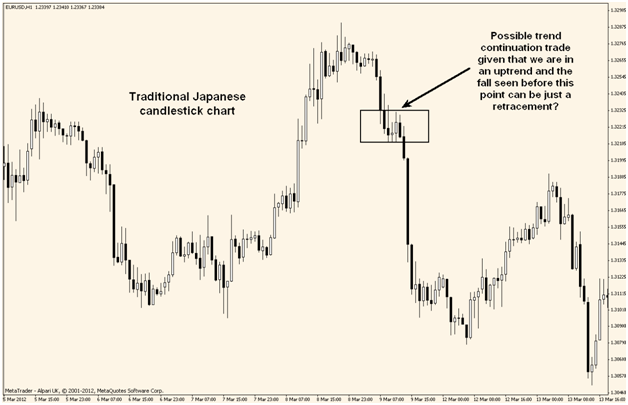
Let us take a look at two pictures, both represent same asset within the same period of time. The first picture is the normal one with japanese candlesticks and the second one is with heikin ashi candles.
As you see on the second picture it is nicely shown the smoothnes of price based on the colors which keeps us in the trade. Best way is that you use this tool to trade in the direction of the trend, with the colors. Blue color represent uptrend or bullish price action while red represents downtrend or bearish price action.
FINALE
It is a great indicator tool and i would definitely recommend it to the beginners because of the simplicity. You can not go wrong with this one if you focus and dedicate some proper time for getting knowledge on basics of technical analysis in binary options.


