
MACD(Moving Average Convergence Divergence) tool was developed in seventies by Gerald Appel. It can help you identify trading opportunities by seeing how strong a move is and also give us indication to which direction we should trade. To simple tell it, it will show you where the price is going and also how strong it is. Tool is made from two moving averages indicators and histogram that gives us distance beetwen these two moving averages. With this we can determine how strong the move is. When you see on the histogram that the lines are getting smaller means that current trend or move is slowing down and reversal can happen. While on the other side if it gets bigger means it is a strong move and it is going to continue this way.
WHAT YOU WILL LEARN HERE:
- What is MACD?
- Why is it bad and why good?
- How to use MACD for trading?
WHY IS IT BAD AND WHY GOOD?
Since it is formed with two moving averages which you may know or not are lagging and also there comes a time when you can see fast price move which is strong and then immediate reverse. Meaning it can not go along because price is too fast. But that does not mean you should give up and it is not a good tool to use. You have to embrace the slowlines and use it for your advantage like in this example, where you are in the trade which has strong trend but is going to retrace. Now, if you would have use fast tool to indicate it would definitely get you out and told you it is moving out of the position while MACD lines will just go close and told you that it is getting weak. Sometimes you can see such fake outs on the market. This can only tell you that there is no perfect tool.
HOW TO USE MACD FOR TRADING?
Let us take a look at particular example and how you use this tool in your advantage. When a cross happens beetwen moving averages it signalizes you for a trade. It just depends in what direction. So if a uptrend cross happens, you should do a CALL trade and if it is a downtrend crossing then you must trade it with a PUT. This is how it looks on the chart:
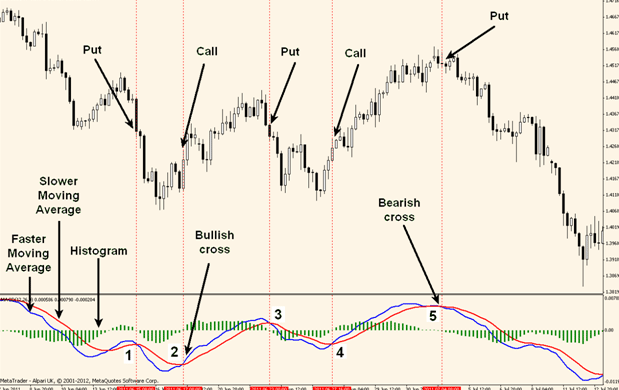
You can histogram at bottom and also the moving averages. Histogram is the green thing that is like bars and sometimes it almost dissapperas, this is when it comes to cross over of the moving average lines. Let us take a look at the numbers you see, they represent all the cross overs that are made and can be tradeable in the case. Keep in mind this is carefully picked for purpose to show you how ti can look. It is not always that good looking since it can even fake sometimes. When you are in the trade and you see a cross in the direction that is not your trade it is tiem to close the trade.