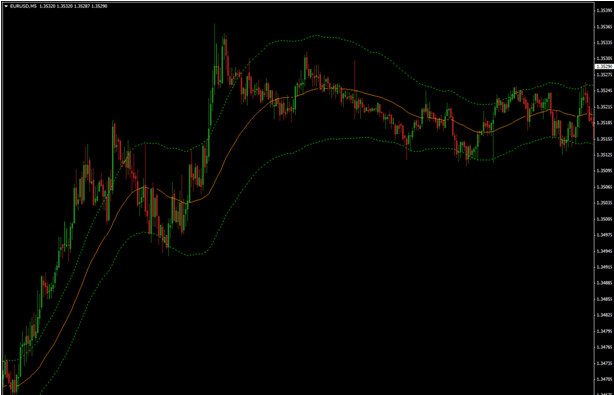
TMA or Triangular Moving Average is as you can already assume from the name itself, resembles other moving average tools. Similarity comes from from showing the price since it is based on previous prices. However it is also different, this one smootheness the price even more. It is displayed on the chart as a line. You also have to know this is not an indicator for trend. You can download it here:
HOW TO USE TMA TOOL?
We do not need to go into details on how this tool works since for that we would need to oncover some mathematical calculations and honestly, we do not need that. It is better to focus on usability of this tool and how to use it for making profits.
At first when you will load it, you will see similarity with boilinger bands but the lines are more smooth. You will be able to determine three lines, one in the middle and two on each side of this middle line. Basic idea of this indicator or tool is that the price moves outisde this two lanes. let it that be on the up side or the downside. That only means that the price is getting out of it comfort zone and therefore it is only a matter of time it will go back. You can see the picture to visualize this, how the price is going out of the zone or touches it.
In majority of the time, the price goes out of the outisde line and gets back inside. You can also see on the left side of the same picture where price did went out of the outside line and continued that way. This is not an indicator i would suggest to use as a starting signal for a trade. For that, you should use this indicator with another one. This tool is giving you direction and that you should start looking at possible trade since there is a chance that there will be a change of direction. When you see the price is on the outside of the upper line, it means that the asset is overbought and when the price is over the outside of lower line, it means it is oversold. Let us focus on the middle line for a moment. It changes from red to blue and around aswell of course. What it does is it gives you indication of the trend.
WHY IS THIS TOOL BAD AND WHY IS IT GOOD?
Only problem that can happen for using this tool is if you do not use it in proper way, meaning that you will exectue trades based only on this indicator. That is why you should keep some other indicator for executing the trades with you aswell. Beside that, there is not much else to say.
FINALE
It can always happen that you will make a bad trade. You are not a robot neither this tool is perfect. Of course when you will use it for the first time you will get even more negative trades, that is why i always suggest to try them out with demo. Beside, it is a very useful tool and it is recommended.

