The Awesome Oscillator tool is something that can surprise you. It is actually popular and there are a lot of information online about it. There is even a trading service that is based on Bill Williams five step trading system. This guy has made a deal of work on oscillators and technical analysis chaos theory. Its indicator is typically a histogram that is the same as MACD however it has some distinctive differences. It is supported of the distinctions in 34 day and 5 day simple moving average or SMA. Its moving average is calculated with the daily bar’s midpoint. The divergence and convergence of both moving averages is put on the histogram with green expanding bars and red contracting bars.
The major difference between MACD and histogram are the bar colors. When you use the awesome oscillator, a signal comes when there is already and expansion in market momentum. For instance, when there is a downtrend in the market and a strong momentum, the histogram bars become longer and turn green. This oscillator offers three major signals. One stringently exclusive to the Awesome Oscillator and two are the same to MACD. You may apply this to various time frames. You can add the Awesome Oscillator with Meta Trade 4 platform by clicking “Insert” then “Indicators” then “Bill Williams” and finally “Awesome Oscillator.”
SIGNALS OF THE AWESOME OSCILLATOR
Zero Line Cross is the very first signal of the three major signals. This signal used to have three varied names on three varied c but all of which are referenced to the cross. This signal is common to oscillators particularly to histograms. There is a midpoint to every oscillator. Every time the midpoint has been crossed it will produce a signal. This is also applicable to Awesome Oscillators. With a bull trend, every time a histogram crosses over a zero line from the bottom, it can generate buy signals. On the other hand, a bear trend is generated on the reverse. This is basically a rather dependable signal particularly with MACD. You may need more practice if you want to take advantage of its effectiveness.
Twin Tops or Twin Peaks is the second signal. This is similar to other oscillators or MACD. You can track in relation to price up trend peaks and down trends in the Awesome Oscillator. When the price makes a new high or low and the Awesome Oscillator will produce lower peak then that is when a divergence is created. This is a contrast signal and must be used with carefulness.
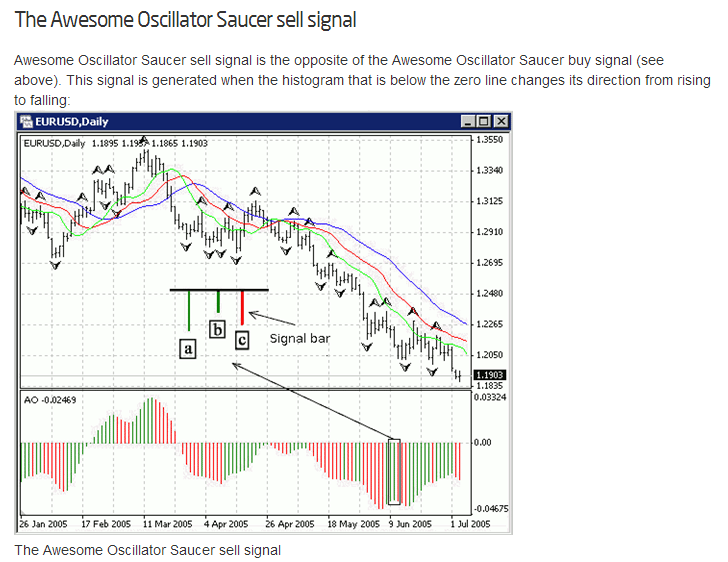
The last but not the least signal is known as the saucer. It remained rather constant on different sites. This is probably because it is a proprietary signal. The signal depends on momentum changes during trends and succeeding changes in colors of the histogram. Moreover, this last signal is the same to various candle stick signals. When there is a trend, signals are produced after stillness in momentum. This will be marked by a histogram color change. Once momentum is fading it turns red. Signals actually need some conditions. One is that you need to know the trend. Next is that you may only trade with trends. Last is that signal is valid only if histogram is on top of the zero level in an upwards trend and at the bottom of the zero in a downward trend. Signal is then produced when histogram is red on two bars then a succession of green bars. For confirmation, Red bar has to be succeeded with a green bar.
WHY IS THE AWESOME OSCILLATOR GOOD?
The Awesome Oscillator does not suck because binary traders can make use of its full potential. It can also be used in varied time frames. It is the same to MACD thereby it can be quite easy to understand. It comes with a simple formula to learn. There is also much information. It offers a one of a kind way to look at markets and offer reliable signals. It can truly fit to just almost any strategy for trading out there. You can used it together with resistance and support, Fibonacci’s Bollinger Bands and moving averages in order to offer signal confirmation.
WHY IS THE AWESOME OSCILLATOR NOT SO GOOD?
There are some limitations of this strategy. It is not so good when used for stocks that are range bound. You may need time for the signals to fully develop and these are best viewed in a market that is already trending. Range’s tops and bottoms will probably produce many traps and whipsaws. Moreover, the AO may also have availability that is limited.

